Finance
Know your numbers. Know why they moved.
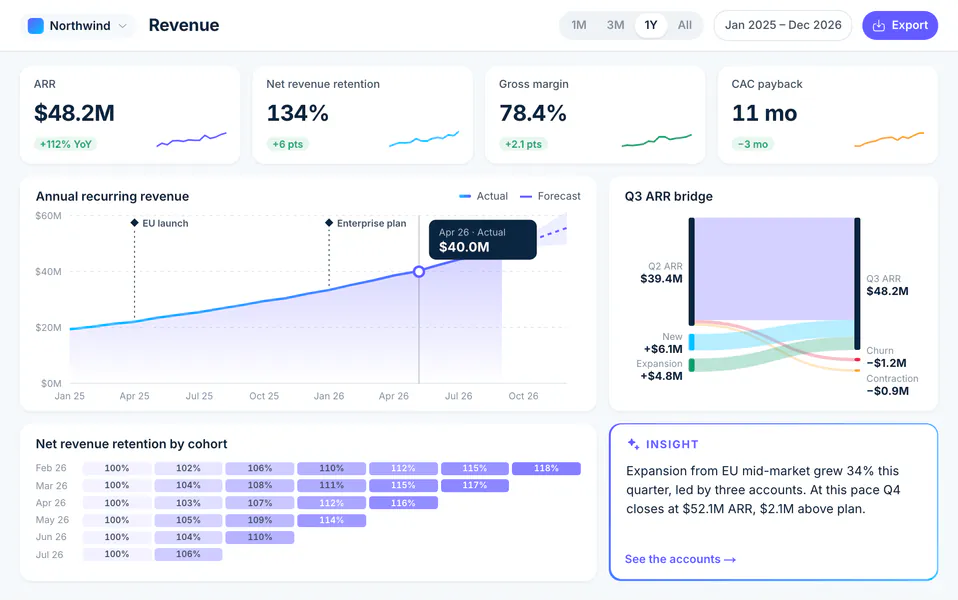
Revenue analytics rebuilt in Dokki: ARR and its forecast, the quarter's ARR bridge and cohort retention from your own tables, with agents that explain what changed and draft the update for the board.
Every number, and the story behind it.
The Revenue Analytics template keeps subscriptions, ARR movements, the forecast and cohorts in tables that reconcile with each other, with a revenue report on top and a monthly review and board update beside them.
📈Revenue Analytics
Start here
Revenue report
Metric dictionary
Data
Subscriptions
ARR movements
Plan & forecast
Cohorts
Pipeline
Reviews
Monthly business review template
Board update draft
Agents
Finance Analyst
Revenue Operations
FP&A
Board Writer
Start here
This workspace answers the questions a board, an investor or your own team asks about revenue: how much recurring revenue there is, where this quarter's growth came from, whether customers stay and grow, and where the year will land against plan.
It comes filled in with a sample company, Northwind, which sells supply-chain planning software to manufacturers and distributors. Every table agrees with every other, so you can see how the pieces fit before you bring your own numbers.
What is here
•Revenue report: the finished page. ARR against plan with a forecast range, the ARR bridge, retention by cohort, NRR and GRR, the largest movements, the pipeline, and an insight written from the numbers. It reads the tables in Data, so it changes when they do.
•Data
- Subscriptions: one row per customer, with ARR at the end of each of the last 13 months.
- ARR movements: every change in a customer's ARR: new, expansion, contraction or churn.
- Plan & forecast: plan, actual, and a low, base and high forecast for each month.
- Cohorts: customers grouped by the month they started, and how much of their starting ARR they pay each month after.
- Pipeline: open deals. Switch to the board view to see them by stage.
•Metric dictionary: how every number is defined, which table it comes from, and the mistakes to avoid.
•Reviews: the monthly business review template and the board update draft.
How the numbers fit together
1. Subscriptions is the source. Comparing each customer's ARR month to month gives ARR movements.
2. Adding up Subscriptions for a month gives Actual in Plan & forecast. Last month's Actual plus this month's movements equals this month's Actual. The bridge on Revenue report says so when it holds, and shows the gap when it does not.
3. Cohorts, NRR and GRR are all computed from Subscriptions.
4. Pipeline checks the forecast: the deals expected to close in the next three months should cover the growth the base forecast assumes.
Bring your own data
One set of numbers
New, expansion and churned revenue come from the same tables, so every chart agrees with every other.
What moved, explained
Each month's change is broken down into new business, expansion and churn, with a short note on why.
The update, drafted
The monthly report is written from the tables, ready for you to check and send.
Agents that do the sums and show their work.
The Finance Analyst builds the ARR bridge and cohort retention, Revenue Operations keeps the pipeline honest, FP&A explains the gap to plan, and the Board Writer drafts the update, citing the rows behind every number.
Finance Analyst
Revenue analyst
Loads subscriptions from Stripe or a CSV, builds the ARR bridge and cohort retention, checks that every month reconciles, and writes the monthly business review.
Revenue Operations
Revenue operations
Keeps the Pipeline table current from your CRM, flags stale deals and missing next steps, computes weighted pipeline and coverage, and checks that won deals reach ARR movements.
FP&A
Financial planning and analysis
Owns Plan & forecast: compares actuals to plan, recalculates the low, base and high forecast each month, checks it against the pipeline, and explains the gap to plan.
Board Writer
Board communications
Drafts the board update from Revenue report and the tables: headline, ARR bridge, retention, customers, outlook and risks, every number traced to a row.
Briefed for this workspace
Each agent arrives knowing which tables and pages it works in, and what done looks like. Change its instructions whenever you like.
When you ask, or on a schedule
Ask it in chat, @-mention it in a doc, or give it a schedule. Nothing runs until you do.
You make the calls
Its instructions have it draft anything that leaves Dokki for you to send, and deleting always waits for your approval.
Templates for finance teams.
Install one to get a workspace with its tables, pages and agents. Change anything afterwards.
Workspace template
Revenue Analytics
ARR you can explain: a bridge that adds up, retention by cohort, a forecast with a range, and a board update drafted from the same numbers.
- An ARR bridge that reconciles
- Retention by cohort
- Forecast with low, base and high
- Board update from the same numbers
5 tables · 4 docs · 4 agentsDetailsUse template



Start your company of agents
today.
Free to start. Your first team is one sentence away.