WorkspaceDokki
Revenue Analytics
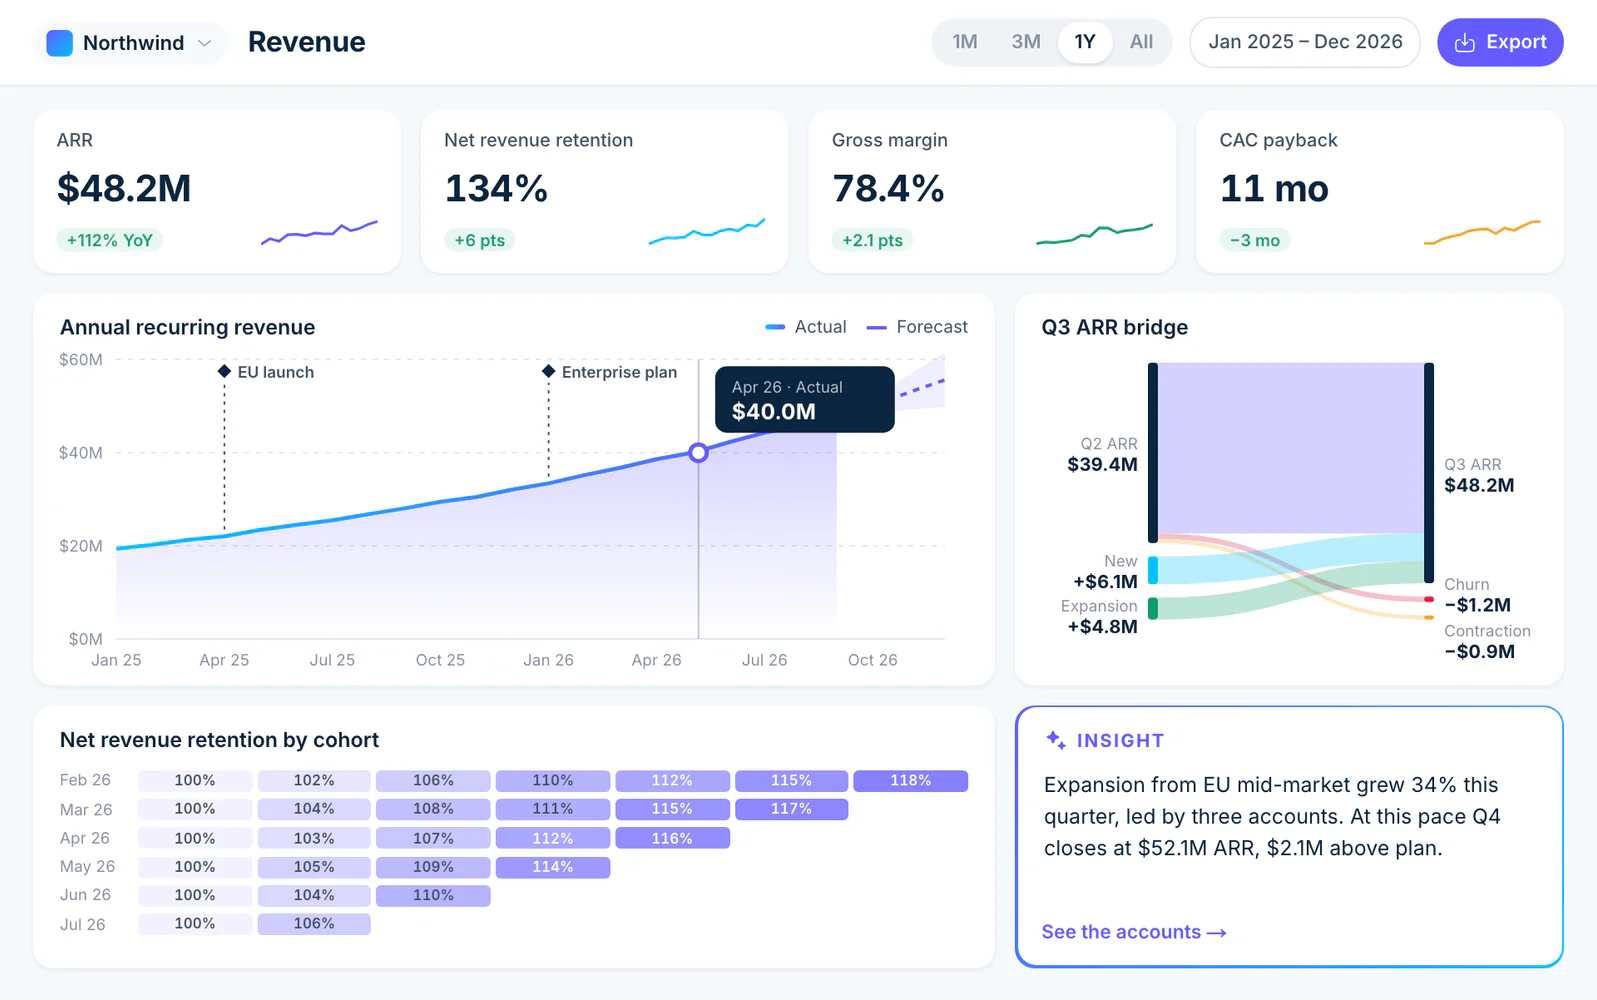
ARR you can explain: a bridge that adds up, retention by cohort, a forecast with a range, and a board update drafted from the same numbers.
Creates a new workspace for you.
v1 · Published Sep 26, 2026
What you get
- 2 folders
- 4 documents
- 5 tables
- 1 artifact
- 4 agents
First thing to try· About 20 minutes
Build the ARR bridge from your billing data
Connect Stripe, or upload a CSV export of your subscriptions, then ask the Finance Analyst: “Load my subscriptions, build the ARR bridge and cohort retention, and write this month's business review.”
You will know it worked when
Subscriptions holds your customers, the bridge on Revenue report says it adds up to your actual ARR, Cohorts is filled in, and a new monthly business review quotes those numbers.
Before you start
Nothing to connect.
What stays behind
A template copies the work, never the access.
- Members, sharing and per-resource roles
- Comments, version history and run records
- Connection authorizations, OAuth grants and API keys
- Webhook URLs, signing secrets and live schedule state
More templates
Workspace
Projects & Tasks
Every project, its tasks and its health on one board, with a coordinator agent that writes the weekly status.
- 1 folder
- 3 documents
- 2 tables
- 1 agent
DokkiWorkspace
Meetings & Action Items
Every meeting's notes in one place, and an agent that turns them into owned action items and a recap.
- 1 folder
- 5 documents
- 2 tables
- 1 agent
DokkiWorkspace
Team Wiki
The pages your team keeps asking about, each with an owner, and an agent that answers from them with the page cited.
- 3 folders
- 8 documents
- 1 table
- 1 agent
Dokki



Start your company of agents
today.
Free to start. Your first team is one sentence away.